eHub API Analytics delivers insights to help optimize costs, track trends, and measure performance. This guide covers key dashboards: Shipment Spend, Shipping Volume, Packages, Zones, and the Home Dashboard.
API Analytics Overview:
- How to track and manage shipment spend
- Monitor shipping volumes and understand package usage
- Analyze shipping trends by region
- Use the Home Dashboard for a quick performance overview
Navigating Analytics Dashboards
To access and navigate eHub’s analytics dashboards:
- Access Analytics: Navigate to API > Analytics.
- Select Shipment Spend, Shipping Volume, Shipping Packages, or Shipping Zones.
- Apply Filters: Use filters such as Last 7 Days, Last Month, or a custom date range to narrow your data.
- Export Data: Click on CSV to download data for further analysis offline.

1. Shipment Spend Overview
Track and analyze your shipping expenses over time with the Shipment Spend dashboard.
How to Access:
1. API > Analytics > Shipment Spend
2. API > Home > Spend
Key Features:
- Graphical Trend: Visualize your spending trends over time.
- Daily Breakdown: View spend by date for granular insights.
- CSV Export: Download data for in-depth analysis.
Example:
Over the last 7 days, your total spend was $2,201.23, with a peak on Nov 15.

2. Shipping Volume Insights
Monitor shipment activity with real-time volume tracking.
How to Access:
1. API > Analytics > Shipping Volume
2. API > Home > Shipment Volume
Key Features:
- Bar Chart: Visualize daily shipment volumes.
- Spend Data: Connect shipment counts with corresponding costs.
- CSV Export: Track shipment details in downloadable format.
Example: Nov 14 saw the highest volume, with 30 shipments

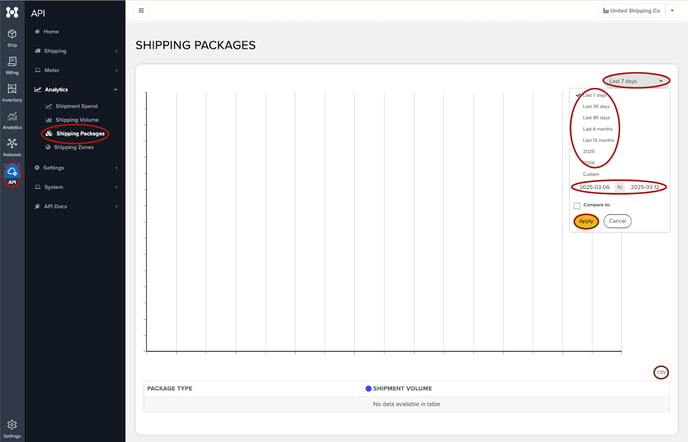
3. Shipping Packages Overview
Understand package size trends to improve efficiency and cost-effectiveness.
How to Access:
1. API > Analytics > Shipping Volume
2. API > Home > Shipment Volume
Key Features:
- Top Package Types: Identify frequently used package sizes.
- Shipment Volume: View the number of shipments associated with each package size.
- CSV Export: Export data for further analysis.
Example: The most common package used is 10.0 x 8.0 x 6.0, with 102 shipments.
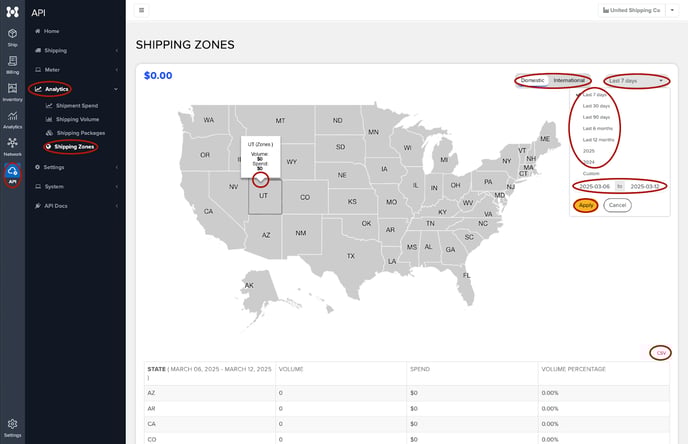
4. Shipping Zones
Gain insights into regional shipping trends with the interactive map.
How to Access:
1. API > Analytics > Shipping Zones
2. API > Home > Shipping Zones
Key Features:
- Interactive Map: Color-coded regions highlight activity levels.
- Regional Breakdown: View shipment and spend data by region.
- Domestic/International Toggle: Focus on specific zones.
Example: 98.55% of shipments are domestic, with $4,803.49 spent in the last 7 days.
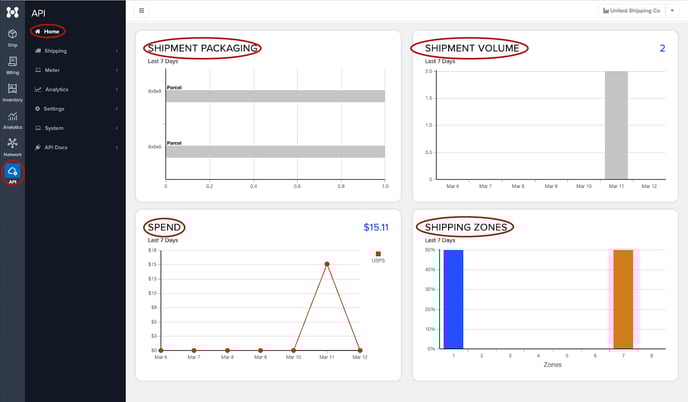
5. Home Dashboard: Comprehensive Overview
The Home Dashboard provides a high-level snapshot of key shipping metrics.
How to Access:
1. API > Home
Key Features:
- Meter Balance: Monitor postage balance and refill recommendations.
- Shipment Packaging: Highlights most-used package types.
- Shipment Volume: Track total shipments over the last 7 days.
- Spend: Analyze spending trends with a line graph.
- Shipping Zones: See a breakdown of activity by region.
Example: Total spend is $5,083.31, with significant use of softpack packaging.
Conclusion
eHub API Analytics enables businesses to make data-driven decisions by providing insights into shipping expenses, package trends, and regional activity. Utilize these features to monitor performance, optimize costs, and enhance your logistics strategy.