![eHub-Logo-FullColor-May-15-2024-07-27-43-6708-PM.png]](https://knowledge.ehub.com/hs-fs/hubfs/eHub-Logo-FullColor-May-15-2024-07-27-43-6708-PM.png?height=40&name=eHub-Logo-FullColor-May-15-2024-07-27-43-6708-PM.png)
Executive Overview
Overview
Executive Overview summarizes shipment activity for a selected account, service type, and date range. Use it to review shipping volume, package mix, delivery performance, and cost trends in one place.
What You’ll See
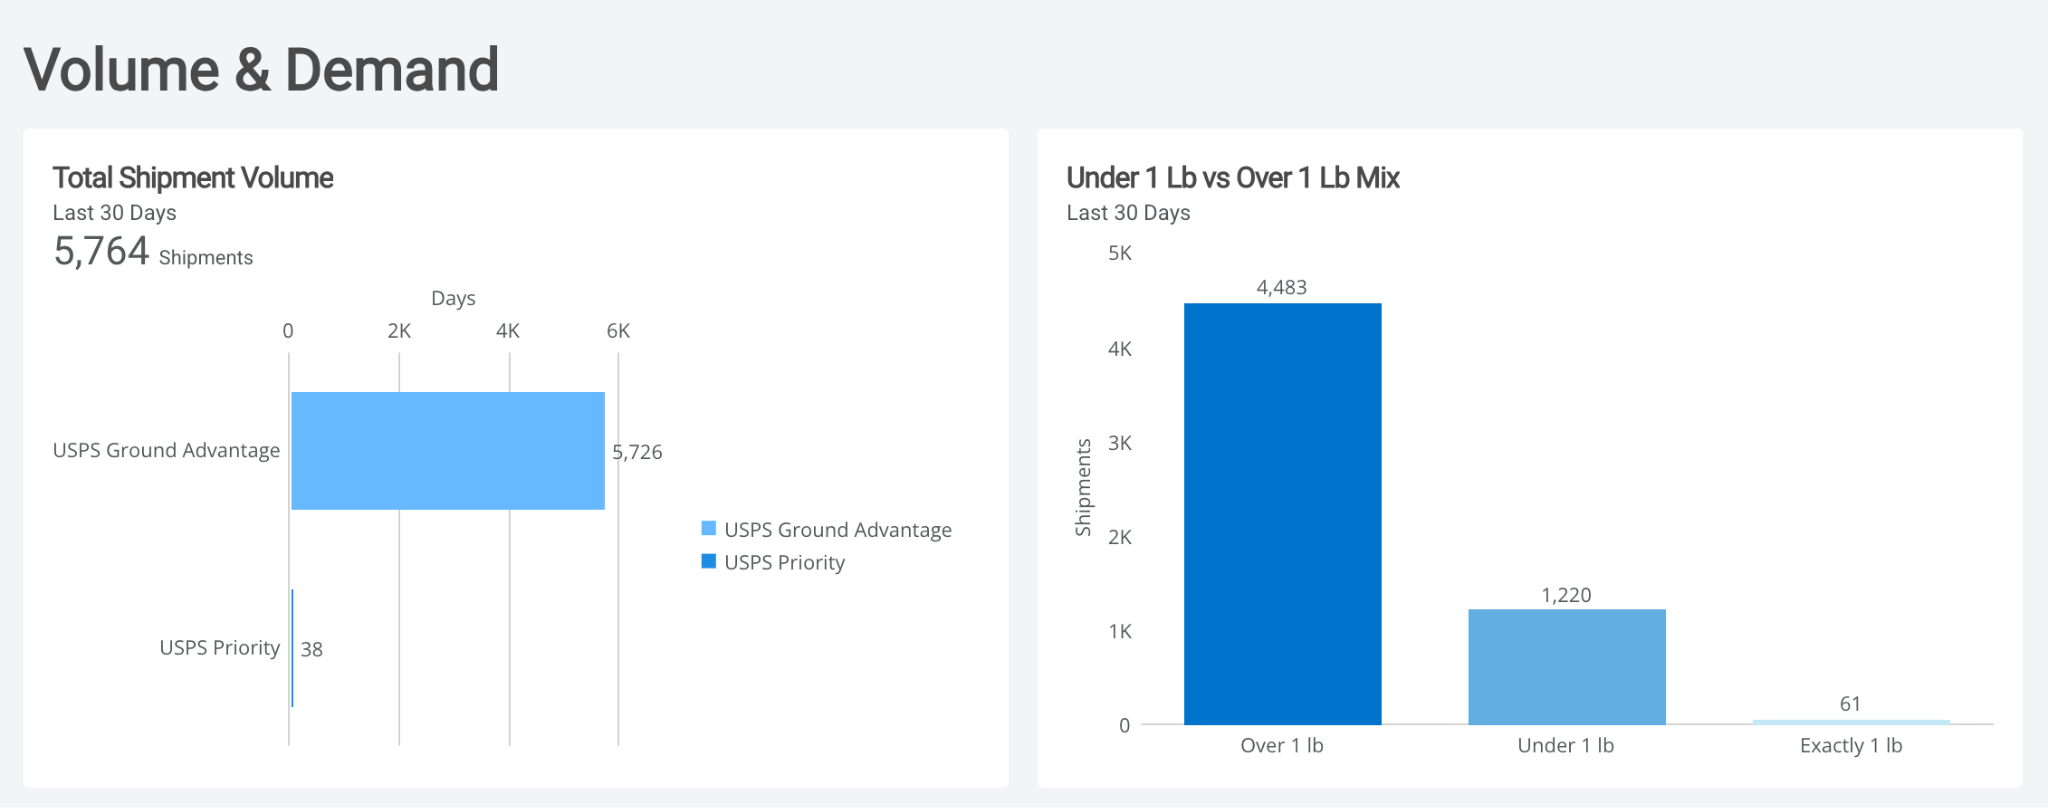
- Volume & Demand: Shipment volume, including total shipments and the mix of shipments under and over 1 lb.
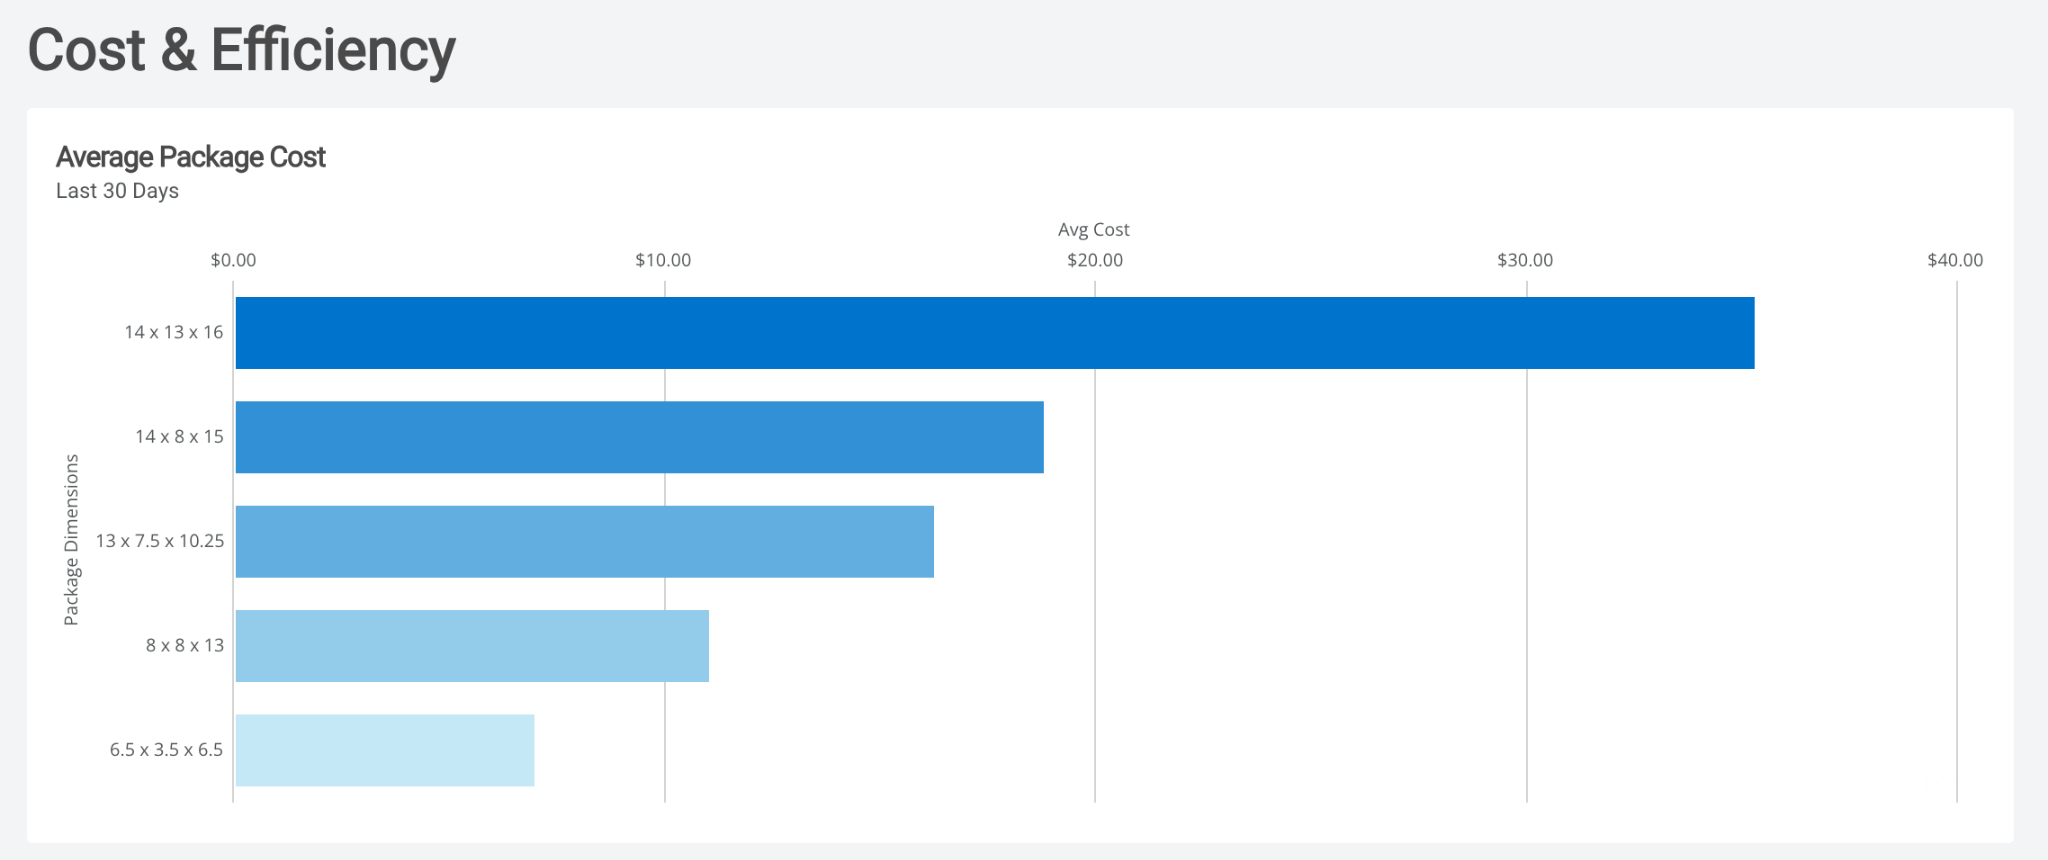
- Shipment and Cost Details: Charts and tables that show shipment activity and cost information for the selected filters.
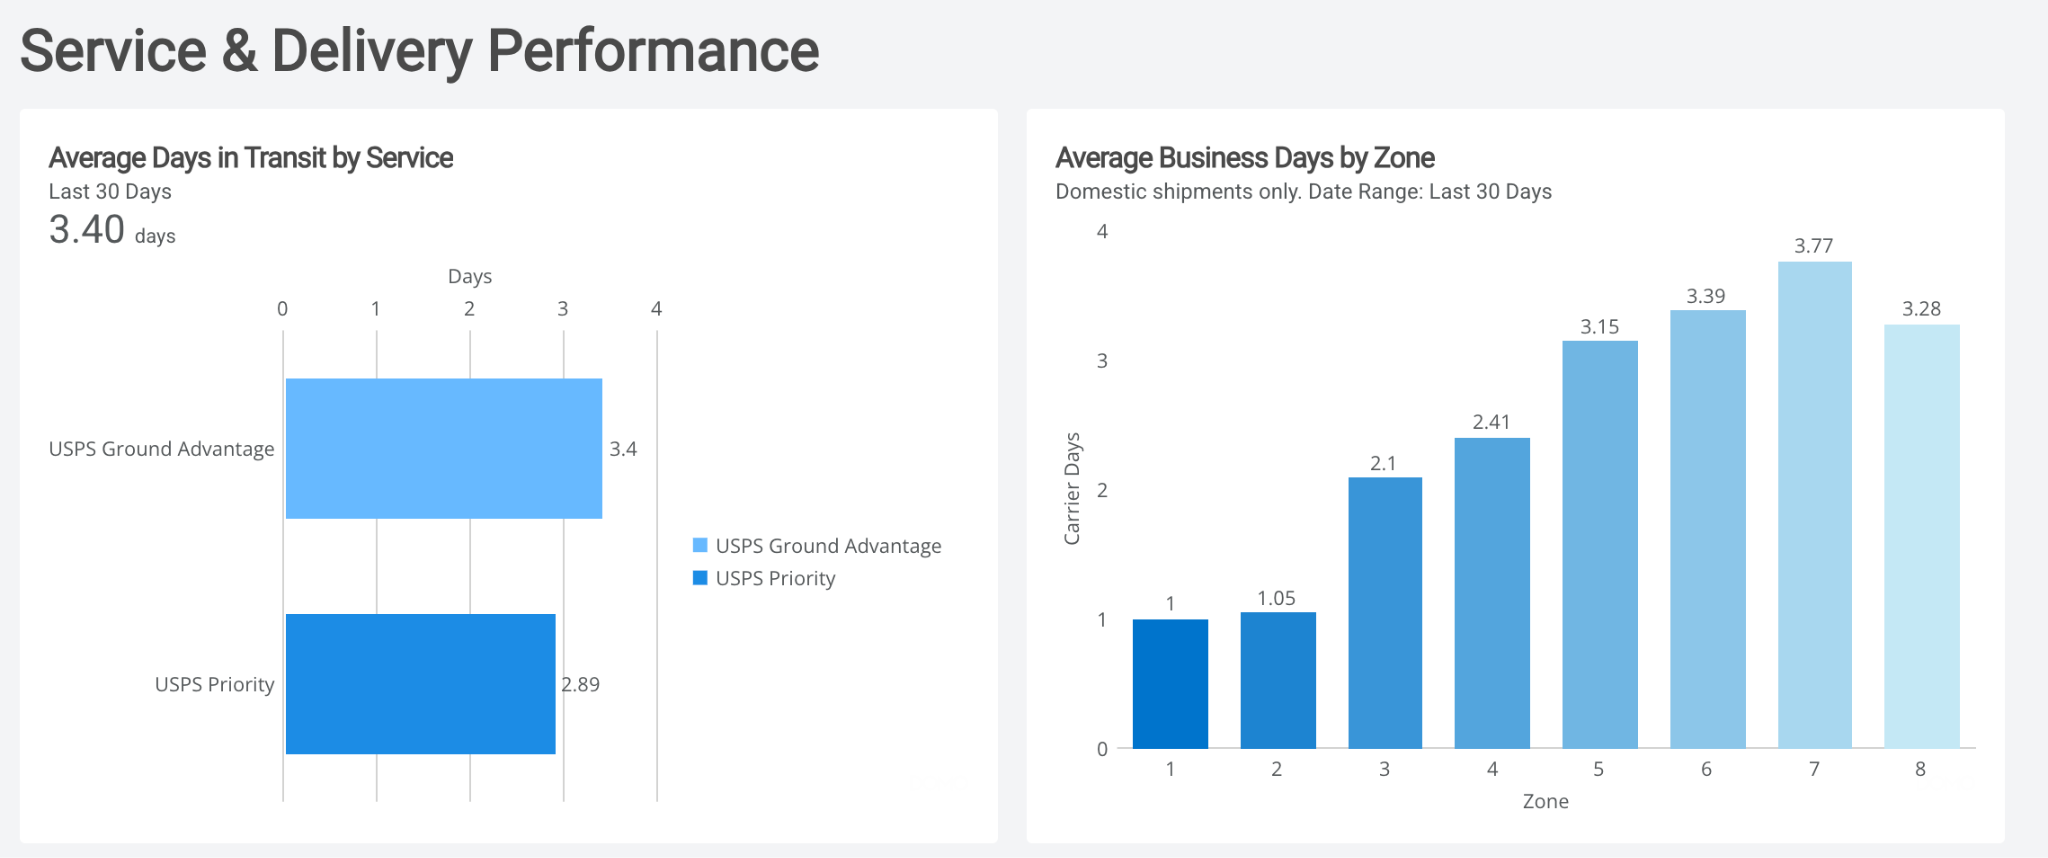
- Service & Delivery Performance: Delivery performance views, with breakdowns by state and shipping zone.
How to Use It
- Select an account.
- Choose a service type or leave the filter broad to see all available services.
- Select a date range.
- Review the summary charts, then use the breakdowns to see how results vary by service or destination.
Carrier Overview
Overview
Carrier Overview helps you review shipment volume, service mix, package weight, shipping costs, and carrier adjustments. Use it to compare services and identify where costs or adjustments are concentrated.
What You’ll See
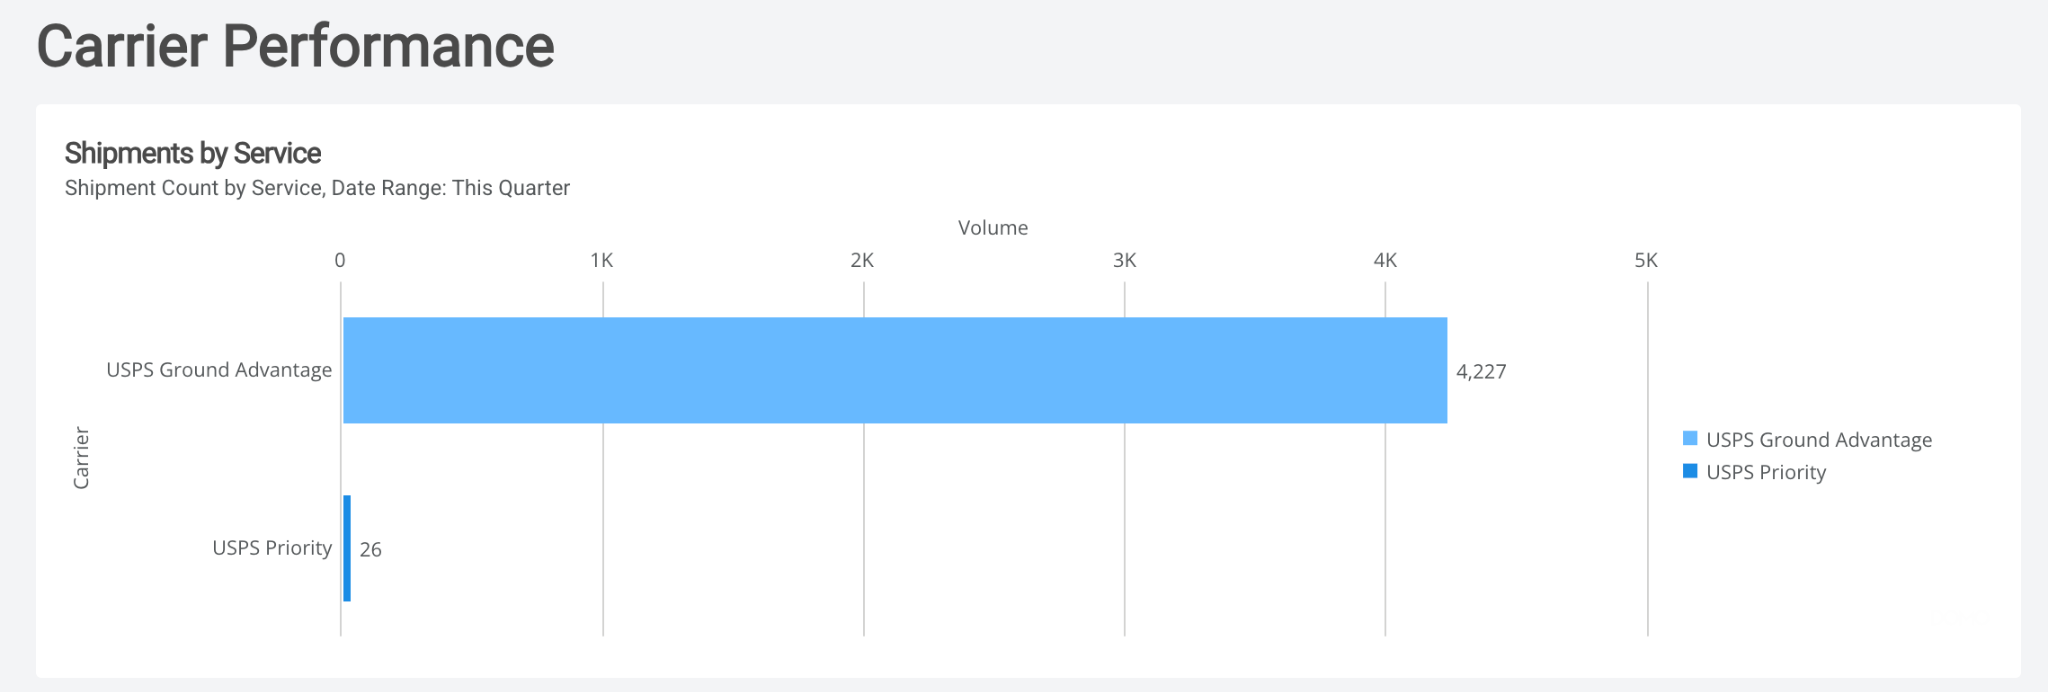
- Carrier Performance: A summary of carrier and service activity.
- Service-Level Breakdown: Shipment volume grouped by service level.
- Weight Distribution: Package weight grouped by carrier or service.
- Average Cost per Zone by Service: Cost trends across zones and services.
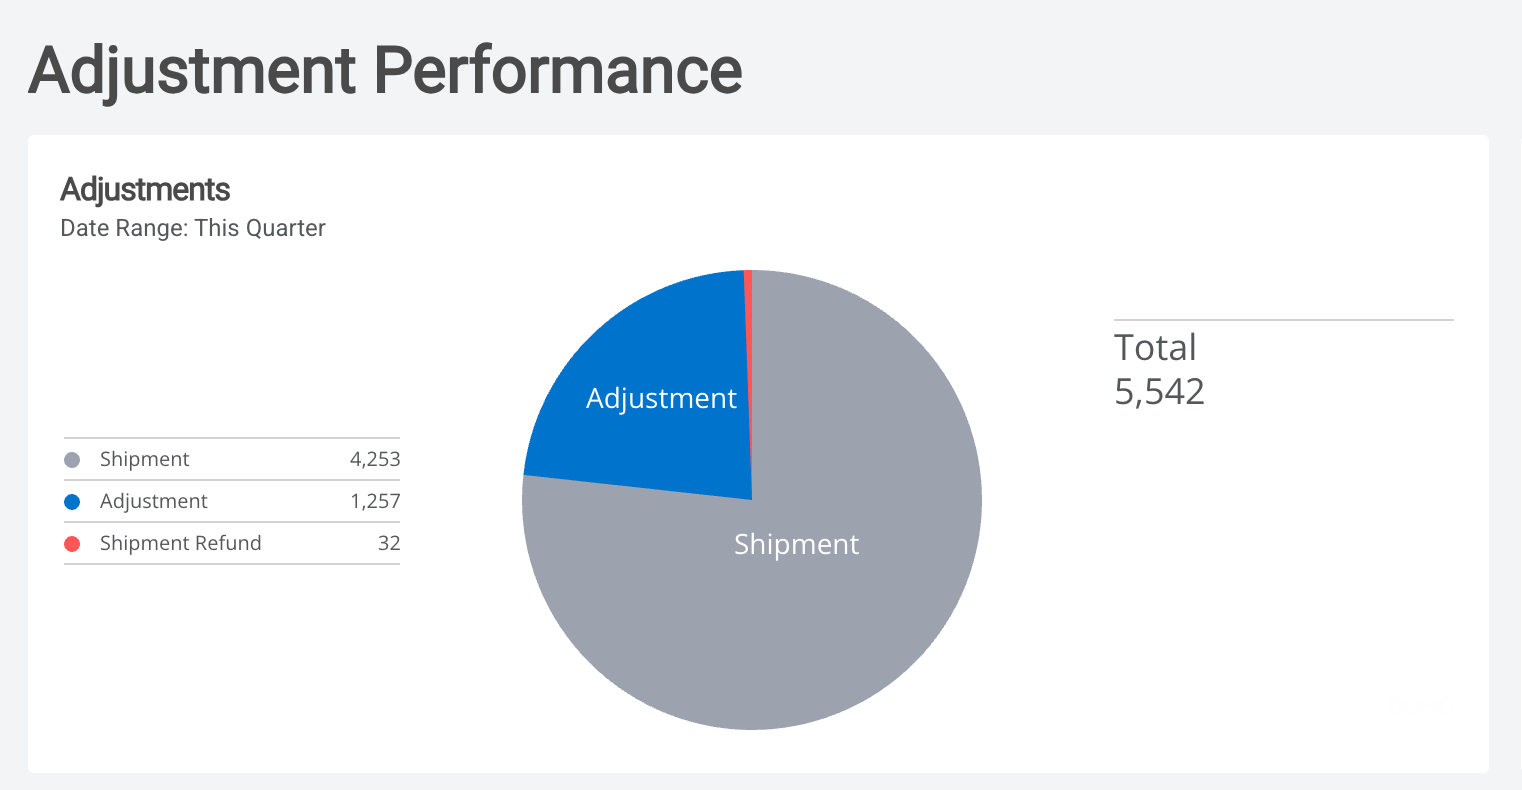
- Adjustment Performance: Adjustment shipment blend and adjustment cost by amount.
- Shipment Details: Tables with service, shipment, and package information.
How to Use It
- Select a sub-customer, if applicable.
- Select a service type and date range.
- Compare the carrier and service charts to see where volume, weight, and cost differ.
- Review adjustment views and shipment details to investigate the results.
Transit Time
Overview
Transit Time provides views of delivery timing across services and destinations. Use it to compare transit patterns by service, zone, state, and ZIP code.
What You’ll See
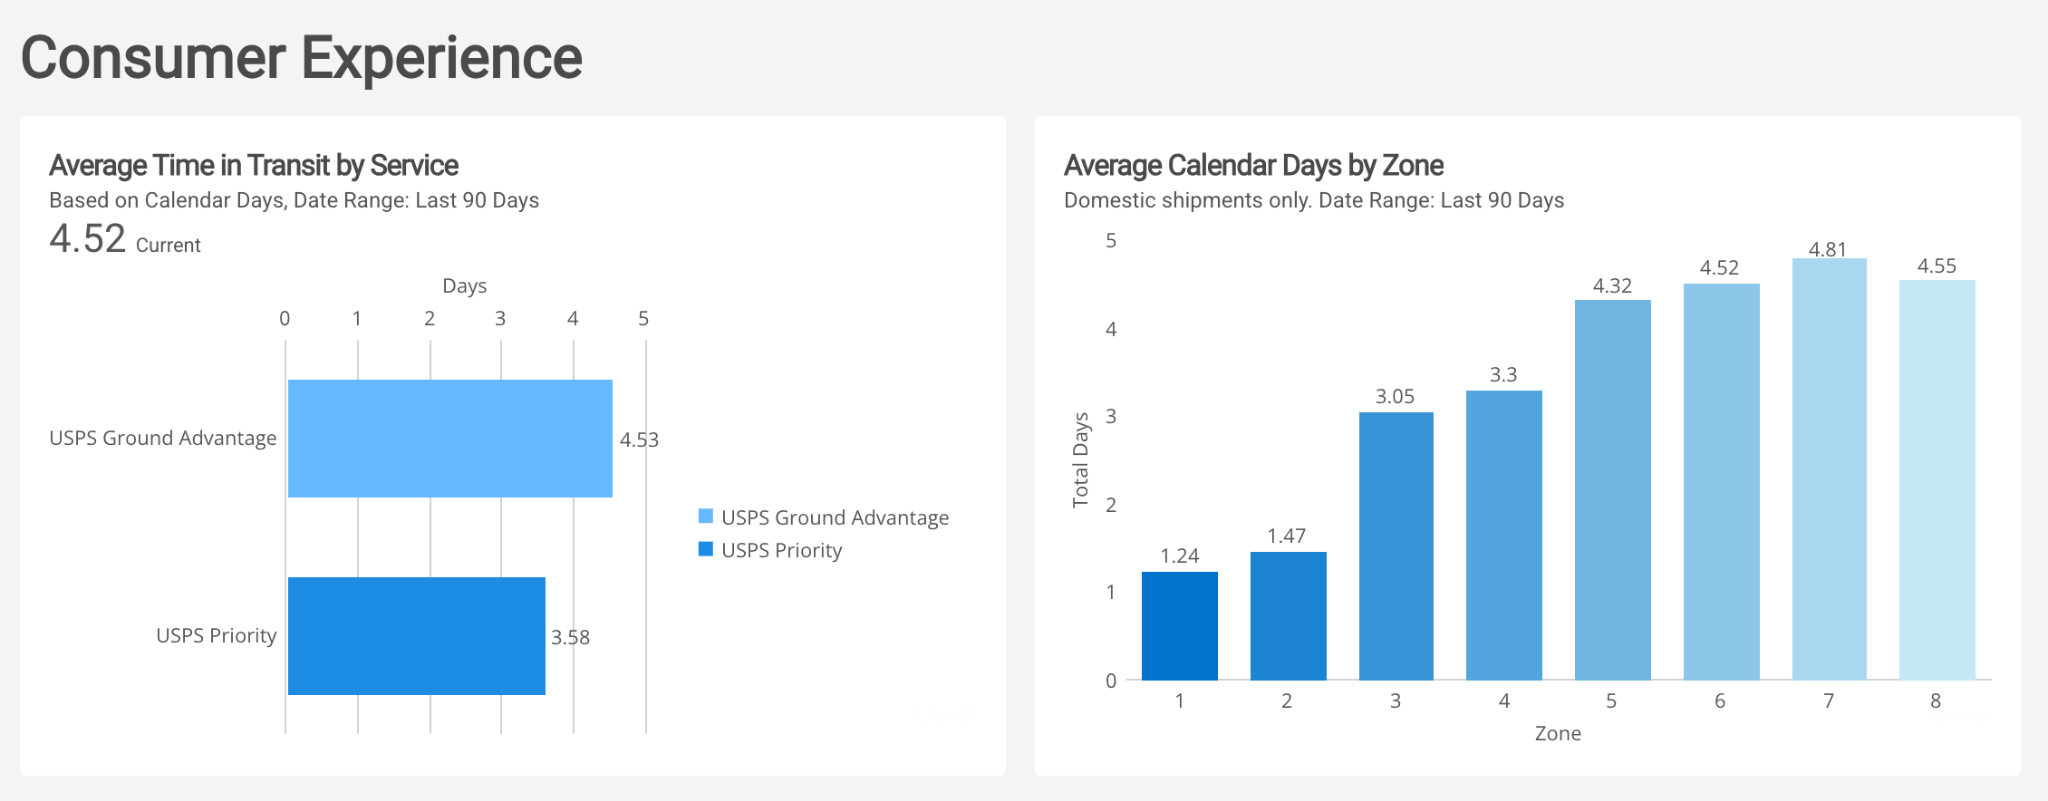
- Consumer Experience: Average transit time by service and average calendar days by zone.
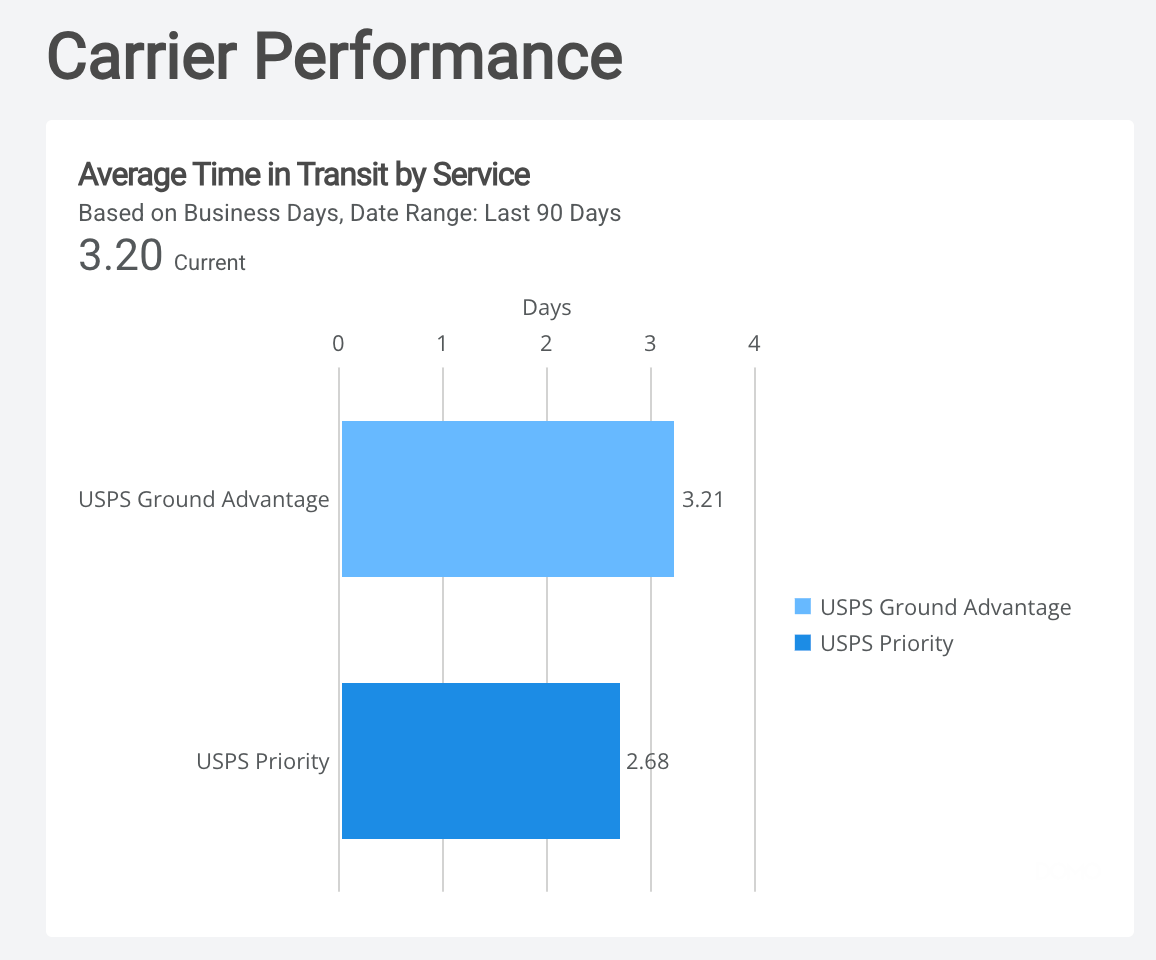
- Carrier Performance: Transit time summaries by service, zone, and state.
- Transit by ZIP: A table with origin and destination ZIP codes and service information.
- Average Transit Time Map: Geographic view of average transit time by destination.
- International Calendar Days Map: Map view of international transit timing.
- Warehouse Performance: Pickup-time view for warehouse-related performance.
How to Use It
- Select a sub-customer, service type, and date range.
- Compare transit-time results across services.
- Use the zone and state breakdowns to see where delivery timing differs.
- Review the maps and ZIP-level table for more geographic detail.